Planning 101: See the Big Picture, Then Go Deep
Start from the overall pattern. Then go deep enough to understand what the number is really telling you.
Let’s switch gears a little and let’s talk about planning.
I don’t want to bother everybody about technicalities, details, and certainly not share any confidential information, so I’ll focus on big picture analysis and how to interpret data.
When analyzing B2B sales, like I had to do for the Server org at Dell, one key number I kept an eye on was conversion rate.
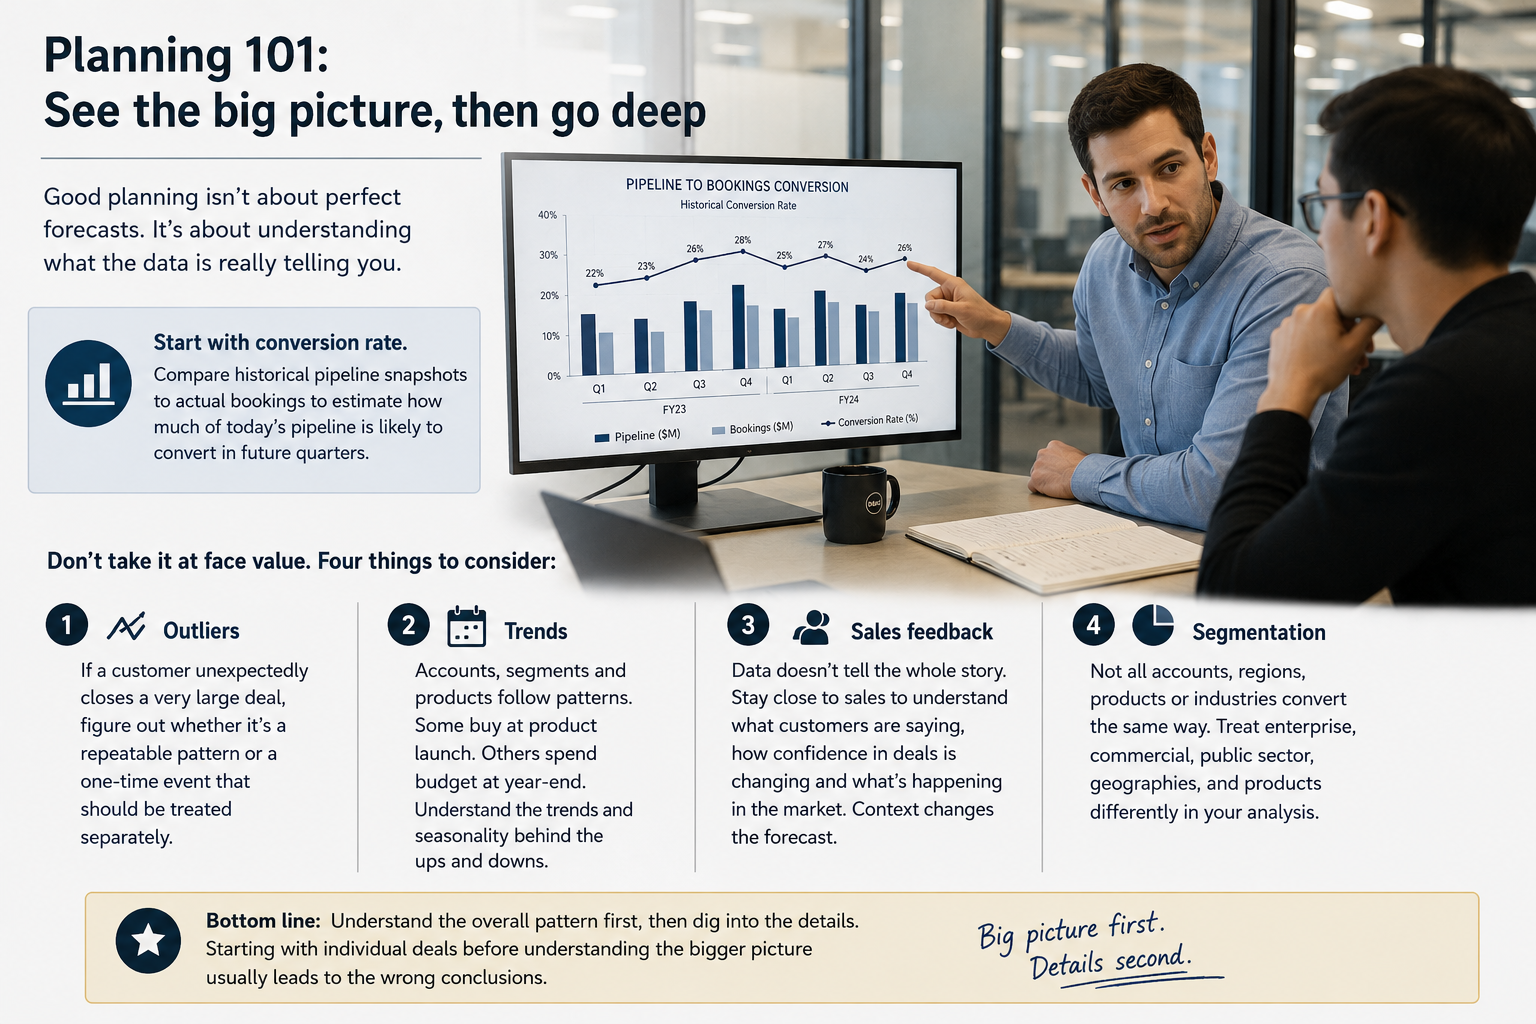
When you’re talking about big and small deals, most of which don’t close in a day but take weeks or even months, and you have pipeline data both looking into the future, but also past pipeline looking into the future, you can compare historical pipeline snapshots against actual bookings to estimate how much of similar pipeline typically converts into revenue.
Conversion rate gives you an initial estimate of what your current pipeline is likely to become in future bookings. But if you take it at face value, it will backfire.
Four things you need to work through
Once you’ve calculated conversion rate, there are four important things you need to consider and work on:
- Outliers: if a customer unexpectedly closed a very large deal, you need to understand if this happens often and might repeat or if it’s something you should eliminate from your analysis.
- Trends: there are accounts, segments, products, and others that might follow certain patterns. They might buy at every product launch. They might spend budget at year-end. You need the data to understand those trends and seasonal patterns, because a spike might look great but not be expected for another year, and a downturn might just be a customer going through their normal cycle.
- Sales feedback: this is key. When we are looking at data, models, and analysis, we tend to think we see the whole picture. But staying close to sales, talking to them, and understanding what’s happening on the ground, what customers are saying, and how the market is moving is what helps you understand what is really going on in your pipeline and how that can affect your final number.
- Segmentation: not all accounts, regions, and products are equal. Some industries always buy the cutting edge, government may have buying cycles, and smaller accounts may purchase just in time when they need it. You need to account for this in your analysis so each input is treated correctly.
Start big picture, then go granular
There’s a lot more nuance and analysis here, but this gives you a great starting point to look at the big picture and then go granular.
If you start with the details, you’ll get lost on the larger view and won’t understand why the numbers look the way they do.
Bottom line
Understand the overall pattern first, then dig into the details.
FAQ
What does pipeline conversion rate tell you?
It gives you an initial estimate of how much of the current pipeline is likely to turn into future bookings based on historical patterns.
Why is conversion rate not enough on its own?
Because outliers, trends, sales feedback, and segmentation can change what that number actually means in the current quarter.
What is the biggest planning mistake?
Starting with individual deal details before understanding the overall pattern and context behind the number.